Why one accuracy number keeps misleading teams
You ship a model that “hits 95% accuracy” in a slide deck, and everyone relaxes. Then support tickets spike: the model misses the rare but expensive cases, or it flags too many normal cases and creates busywork. Accuracy hides this because it treats every mistake as equal and every example as equally common. In a skewed dataset, a model can look great by mostly predicting the majority class. Even when overall accuracy is stable, performance can be uneven across customer segments, and the same number can come from very different error patterns.
A single accuracy number also ignores confidence and operating thresholds, so it can’t tell you whether “95%” means safe automation or risky guesswork.
Start with the job: what “good” looks like
Picture the actual moment the prediction will be used: a fraud alert that blocks a purchase, a support classifier that routes a ticket, a medical note summarizer that fills a chart. “Good” starts as an operational decision, not a metric. What happens if the model is wrong, who pays the cost, and how often can you tolerate that cost? Write that down as a target behavior: which errors are unacceptable, which are annoying but manageable, and which are harmless.
Then define the action the model is allowed to take. Is it full automation, a ranked list for a human, or a “review required” gate? Each choice implies different requirements: speed, explainability, confidence, and fallback paths when the model is unsure. This is where you set an explicit threshold and a coverage goal (what percent of cases you want to auto-handle). Be prepared for a trade-off: pushing for higher coverage usually raises risk, and human review capacity is a real constraint.
When the same accuracy hides very different mistakes

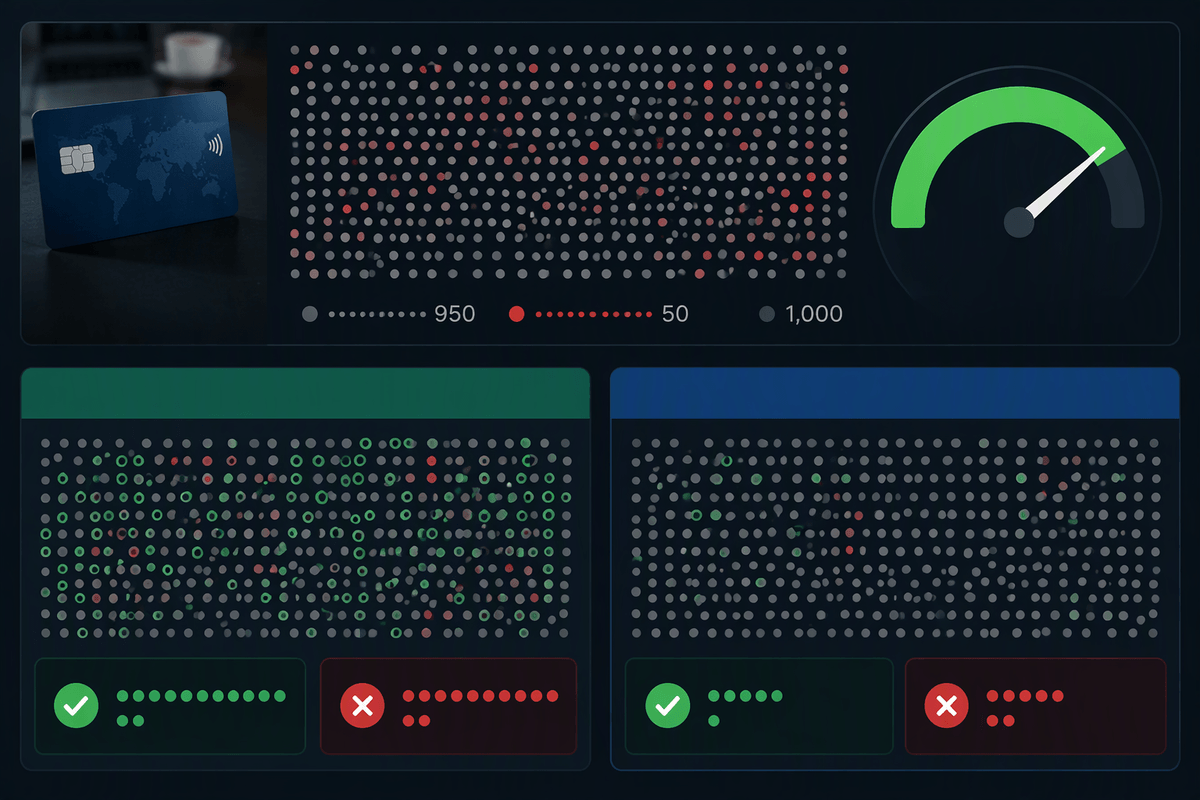
Two models can both report 95% accuracy and behave nothing alike. Imagine 1,000 weekly transactions with 50 frauds. Model A catches 45 frauds but wrongly blocks 95 legitimate purchases. Model B blocks only 10 legitimate purchases but catches just 5 frauds. Each can land near the same overall accuracy because the 950 legitimate cases dominate the math, yet one creates customer churn and support load while the other quietly leaks losses.
The same problem shows up even without class imbalance: a model can make “easy” mistakes on a common segment and “hard” mistakes on a smaller, high-value segment, and the average stays flat. The only way to see this is to break errors into false positives and false negatives (a confusion matrix), then compare them at the threshold you plan to use. Checking multiple thresholds matters too, but it costs time: you need labeled examples in the rare cases, and those labels are usually the most expensive to get.
Picking metrics that match your failure costs
Once you’ve named which mistakes hurt, pick metrics that make those mistakes visible. If a false positive creates customer churn or compliance friction, you care about precision: when the model flags something, how often is it truly a problem? If a false negative leaks money, safety incidents, or missed opportunities, you care about recall: how many of the true problems you catch. For heavily imbalanced work (fraud, rare defects), precision–recall curves are often more informative than ROC curves because they reflect what happens when positives are scarce. If you need a single score for comparison, use it knowingly: F1 weights precision and recall equally, while an F-beta score can lean toward recall when misses are expensive.
When costs are asymmetric, translate metrics into impact: “At this threshold, we’ll review 3% of orders, miss 12 frauds per week, and block 40 legitimate purchases.” Calibration matters here—if “0.9” doesn’t mean “about 90%,” threshold choices become guesswork. The “best” threshold on paper may be impossible if it demands more human reviews, labeling, or latency than your operation can support.
Look past averages: slices, edge cases, and fairness

Averages also hide where the model is brittle. A support classifier might be “fine overall” but fail on new product lines, customers using non-standard phrasing, or tickets written in a second language. Slice your evaluation by the categories that drive outcomes: region, customer tier, device type, new vs. returning users, channel, and anything tied to different error costs. Don’t just report per-slice accuracy; compare false positives and false negatives per slice at the same operating threshold, because that’s what determines who gets blocked, routed, or escalated.
Edge cases deserve their own bucket, even if they’re rare. Pull examples from recent incidents, policy exceptions, and “long tail” inputs that users actually produce. This is where labeling is slow and expensive, but it’s also where surprises live.
Fairness work is the same discipline with higher stakes: measure performance and error rates across protected or sensitive groups, then decide what parity means for your use case. If improving one group’s recall increases another’s false positives, make that trade-off explicit before launch.
Test like production: drift, robustness, and uncertainty
Strong test-set results do not guarantee reliable performance once real-world conditions begin to change. Seasonal demand shifts, new features alter user behavior, policy wording gets revised, attackers adapt, and customers introduce unfamiliar slang. Training on last quarter’s data may produce acceptable average scores while performance deteriorates in the cases that matter most. Time should therefore be part of the evaluation design. Test against the most recent labeled data available, and maintain a small holdout that resembles future production conditions, including the same preprocessing, missing fields, and latency limits.
Production inputs rarely arrive in perfect condition. Include corrupted or incomplete records, unfamiliar terms, typos, and changes in camera quality or device type. Evaluation should also examine how the model handles uncertainty. Does it abstain, send doubtful cases for human review, or return a confident answer despite insufficient evidence? Calibration tests and a defined fallback process help answer these questions. Ongoing labeling and monitoring require sustained effort, but without them, genuine drift is difficult to separate from random variation. Teams may end up discovering the same weaknesses only after an incident exposes them.
A practical evaluation checklist you can reuse
You can reuse a simple checklist before any go/no-go: define the decision, the allowed action (auto, assist, or review), and the maximum error you can tolerate. Report a confusion matrix at the chosen threshold plus precision, recall, and the expected weekly counts of false positives/false negatives. Verify calibration (do scores match real frequencies) and set an abstain rule tied to review capacity. Slice results by the segments that change cost or risk, and include a curated edge-case set from real incidents. Finally, re-run on most recent data, stress messy inputs, and confirm latency and per-call cost fit production budgets.